Real-time liquidity dashboards: what to look for and how to build one
What should a real-time liquidity dashboard show? Find out the key metrics, the bank and ERP connections behind them, and whether to build, buy or extend.
For most finance teams, the daily ritual looks like this: log into multiple bank portals, pull a snapshot of the balances, paste figures into a spreadsheet, clean the data, aggregate it, and – eventually – send the CFO a number that’s already hours old.
The treasury team runs the same manual exercise multiple times a day, to manage liquidity. All the log-ins. Authentications. And re-logins when your e-banking portal kicks you out while someone disturbs your attention for a minute.
Too many sources, too slow, too much repetitive manual work. A real-time liquidity dashboard fixes that – especially when you can log on in seconds with your existing corporate SSO (single sign-on).
This guide covers what a liquidity dashboard is, how the data connections work, and what to look for when deciding whether to build or buy.
The metrics a liquidity dashboard should surface
A well-designed dashboard applies a hierarchy: a small number of critical metrics always visible, a broader set available with minimal navigation, and deeper drill-downs accessible on demand.
What sits at the top of that hierarchy differs by role.
The CFO wants the consolidated cash position, the forecast and the handful of figures that speak to risk and covenant headroom. A treasury analyst needs the same underlying data broken down by entity, bank and bank account – understanding there is cash in the right currency, in the right account, before the payment runs hit.
This is one reason adaptable treasury platforms matter. The same live data set can be configured into different views for different people, rather than one dashboard trying to serve everyone at once – with data profiles to set per team to manage accesses.
Here are the categories that matter most:
Consolidated cash position
The core of any liquidity dashboard. This is a consolidated view of current balances across all bank accounts, legal entities, and geographies – updated throughout the day rather than once overnight.
This view is particularly useful when you can filter and sort the data – for example, filtering by business unit, region or country.
For multinationals operating across multiple banking relationships, or any business looking to see centralised cash versus cash in local accounts, having a consolidated real-time view removes the need for manual aggregation that can otherwise consume hours of treasury time.
When cash is held in multiple currencies, you should be able to view each balance in its account currency and in the group’s reporting currency side by side – and filter by currency as easily as by entity or country.
Short-term cash forecast vs actuals
Cash forecasting accuracy is a direct indicator of how much trust the CFO can place in the numbers. According to PwC’s 2025 Global Treasury Survey, 76% of treasury teams cite poor data quality as the primary obstacle to better forecasting.
A dashboard that tracks forecast-versus-actual variance makes that data quality problem visible and measurable, which is the first step to improving it.
To set this up, the key step is incorporating flexible tagging of bank account transactions to categorise cash flows. Read our article on the role of cash flow tagging for more on this.
Total liquidity position
Available liquidity is broader than cash on hand. It includes committed credit facilities, overdraft headroom, and short-term investment positions that can be converted quickly. A dashboard that shows only bank balances will understate the organisation’s true liquidity position – and overstate the urgency of apparent shortfalls.
Combining internal cash reserves with external liquidity sources into a single total-available-liquidity figure – split into available and restricted liquidity – is essential.
FX exposure
For companies operating across multiple currencies, unhedged foreign exchange exposure is one of the largest sources of liquidity risk. A CFO-level dashboard should surface the organisation’s FX position in near real time – showing exposure by currency pair, the proportion of net exposure that is hedged, and how upcoming cash flows are affected by exchange rate movements.
Debt maturity and covenant headroom
A 30/60/90-day view of upcoming debt maturities addresses refinancing risk before it becomes urgent. Paired with covenant metrics – which often incorporate cash and liquidity balances as key inputs – this gives the CFO a forward-looking read on financial obligations and the room available to meet them.
Working capital indicators
Days Sales Outstanding (DSO), Days Payable Outstanding (DPO) and the cash conversion cycle belong on a liquidity dashboard because they directly affect the cash position – especially for manufacturers, distributors, logistics providers and B2B service businesses.
The effect adds up quickly. One day of DSO is worth roughly annual revenue divided by 365, so for a company with €500 million in revenue, a three to four day improvement releases around €4 to 5.5 million in working capital. For multi-entity groups, where receivables and payables are spread across subsidiaries, banks and ERPs, bringing these figures together is often the hardest part.
Seeing DSO, DPO and the cash conversion cycle alongside live cash balances supports faster decisions. Treasury teams can time supplier payments to make the best use of cash within agreed terms, see where to push on collections, and check whether working capital is moving in the right direction.
Counterparty and bank exposure
Having enough cash is not the same as having it safely placed. A group can show a healthy consolidated position and still carry real liquidity risk if a large share of that cash sits with a single bank or counterparty.
A CFO-level dashboard should show exposure by counterparty against pre-set limits, so concentration is visible before it becomes a problem rather than after a counterparty runs into difficulty. This matters most for organisations holding balances across several banking relationships and jurisdictions, where it is easy to lose track of exactly where cash is parked and how exposed the group is to any one institution.
The data connections that make it work
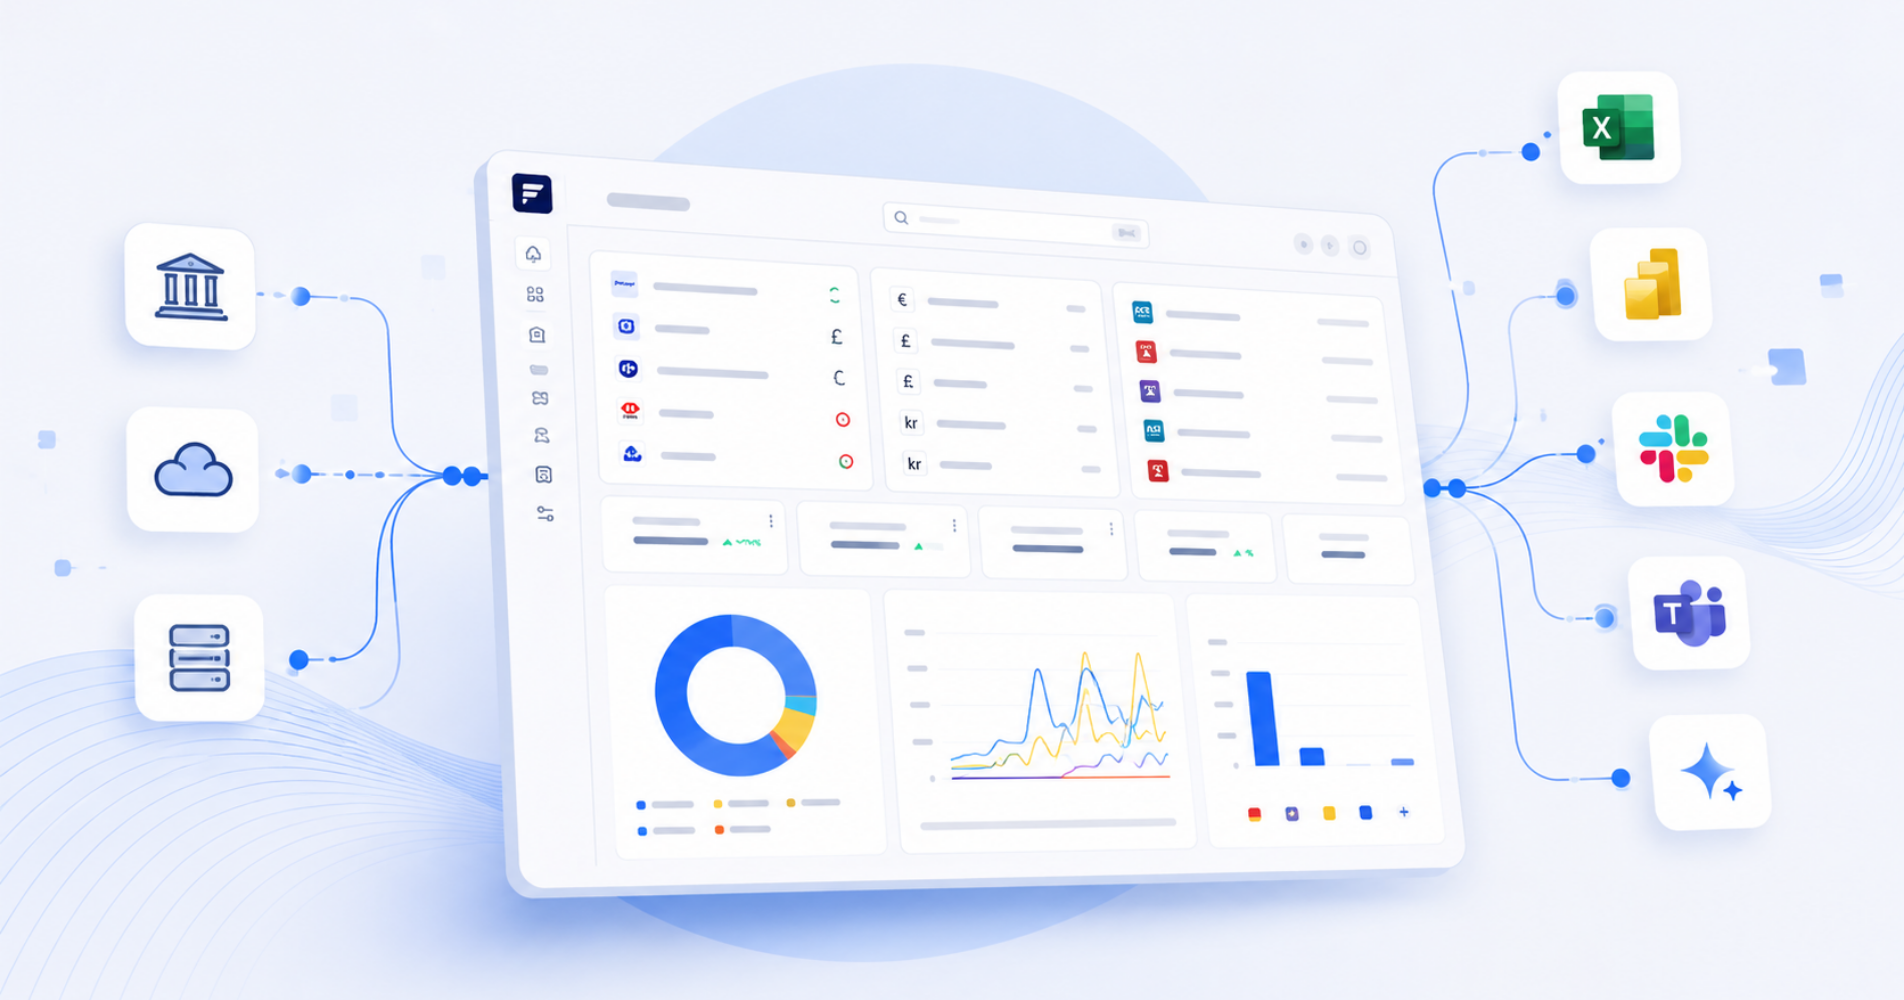
A dashboard is only as good as the data behind it. The question of data quality is really a question of connectivity – how the dashboard pulls information from the systems that hold it – and how the data is normalised, making it structured and consumable by any system and dashboard.
Bank connectivity
The most fundamental connection. Historically, treasury teams relied on file transfers or host-to-host connections that pushed bank data in batches at fixed points during the day. Modern dashboards replace batch processing with direct API connections to banking partners, pulling balance and transaction data in near real time.
The practical difference is significant. API-based connectivity means a multinational CFO can have a consolidated global cash position available anytime – by logging-in in seconds with their corporate SSO – rather than after a lengthy manual consolidation process. You have up-to-date figures available on your mobile while having a morning coffee, and with intraday updates – tracking cash movements through the day rather than at the end of it.
For organisations with multiple banking relationships, the breadth of bank coverage matters. Pre-built connectors to a wide network of banks reduce implementation time and avoid the need for custom integrations with every institution.
Video
Banking APIs in action: from steering through a crisis to managing cash at scale
Jacob Koch is an experienced group treasurer who has implemented FinanceKey at two different companies – steering treasury through very different challenges at each.

ERP and other system integrations
Bank balances are only part of the picture. The data that drives the cash position in the days and weeks ahead sits across several systems. The ERP holds payables and receivables, and HR systems hold payroll. The treasury management system (TMS) typically holds debt schedules, hedging positions and investments. Intercompany transactions may sit in the TMS or only appear in bank statements when they are executed from e-banking portals.
A liquidity dashboard that relies only on bank data, or on manual uploads from these systems, gives an incomplete or out-of-date picture. The dashboard should connect to each source and reconcile the data into one coherent view, so treasury does not have to bridge the gaps manually.
Automated reconciliation
Manual reconciliation is where treasury time disappears. When bank data, ERP postings, and forecast assumptions do not automatically align, someone has to find the differences and resolve them. Automated reconciliation – matching transactions across sources without human intervention – removes that burden and ensures that the numbers on the dashboard reflect reality.
It also improves forecast quality. If actuals are always up to date, variance analysis is more reliable, and the forecast model has cleaner data to work from.
Build, buy, or extend?
The practical question for most organisations is not whether to have a liquidity dashboard but how to get there. There are four main paths:
Building from scratch using a BI tool like Power BI, Tableau, or similar is feasible for organisations with internal data engineering capacity. The visualisation layer is the easy part. Building and maintaining the connectors to banks, ERPs, and other upstream systems is where the real effort sits – those integrations require ongoing maintenance as banks update their APIs, ERP versions change, and the business adds banking relationships.
Buying a purpose-built solution – a treasury management system or dedicated cash visibility platform – may get you pre-built bank connectivity, pre-configured data models, and a dashboard framework designed for treasury use cases. The trade-off is that off-the-shelf systems vary widely in flexibility, particularly around custom KPIs, multi-entity structures, and the ability to configure views for different audiences.
Extending an existing TMS or ERP works for organisations that already have a treasury platform and want to expose its data to a separate reporting or visualisation layer. The viability depends on whether the platform supports open APIs – and on whether the data model is flexible enough to support the views the business actually needs. Configuration effort requires typically external consultants, and system integrators are often needed for building the connectivity.
Keep Excel – but connect it. For teams that want to keep working in Excel, an open data architecture – such as OData connectivity – allows live treasury data to flow directly into existing spreadsheet models on demand. The spreadsheet becomes a front-end to a live source of truth rather than a parallel system running on stale exports. This approach still requires a reliable source of standardised, real-time data.
The right path depends on where the data friction actually sits – in connectivity, in consolidation of the data, in reporting flexibility, or in all three.
How FinanceKey approaches real-time liquidity visibility
If you’re evaluating solutions to build this capability, FinanceKey is a treasury orchestration platform designed for companies that need consolidated cash visibility across multiple banks, entities, and currencies – without replacing their existing banking relationships, ERP or other systems.
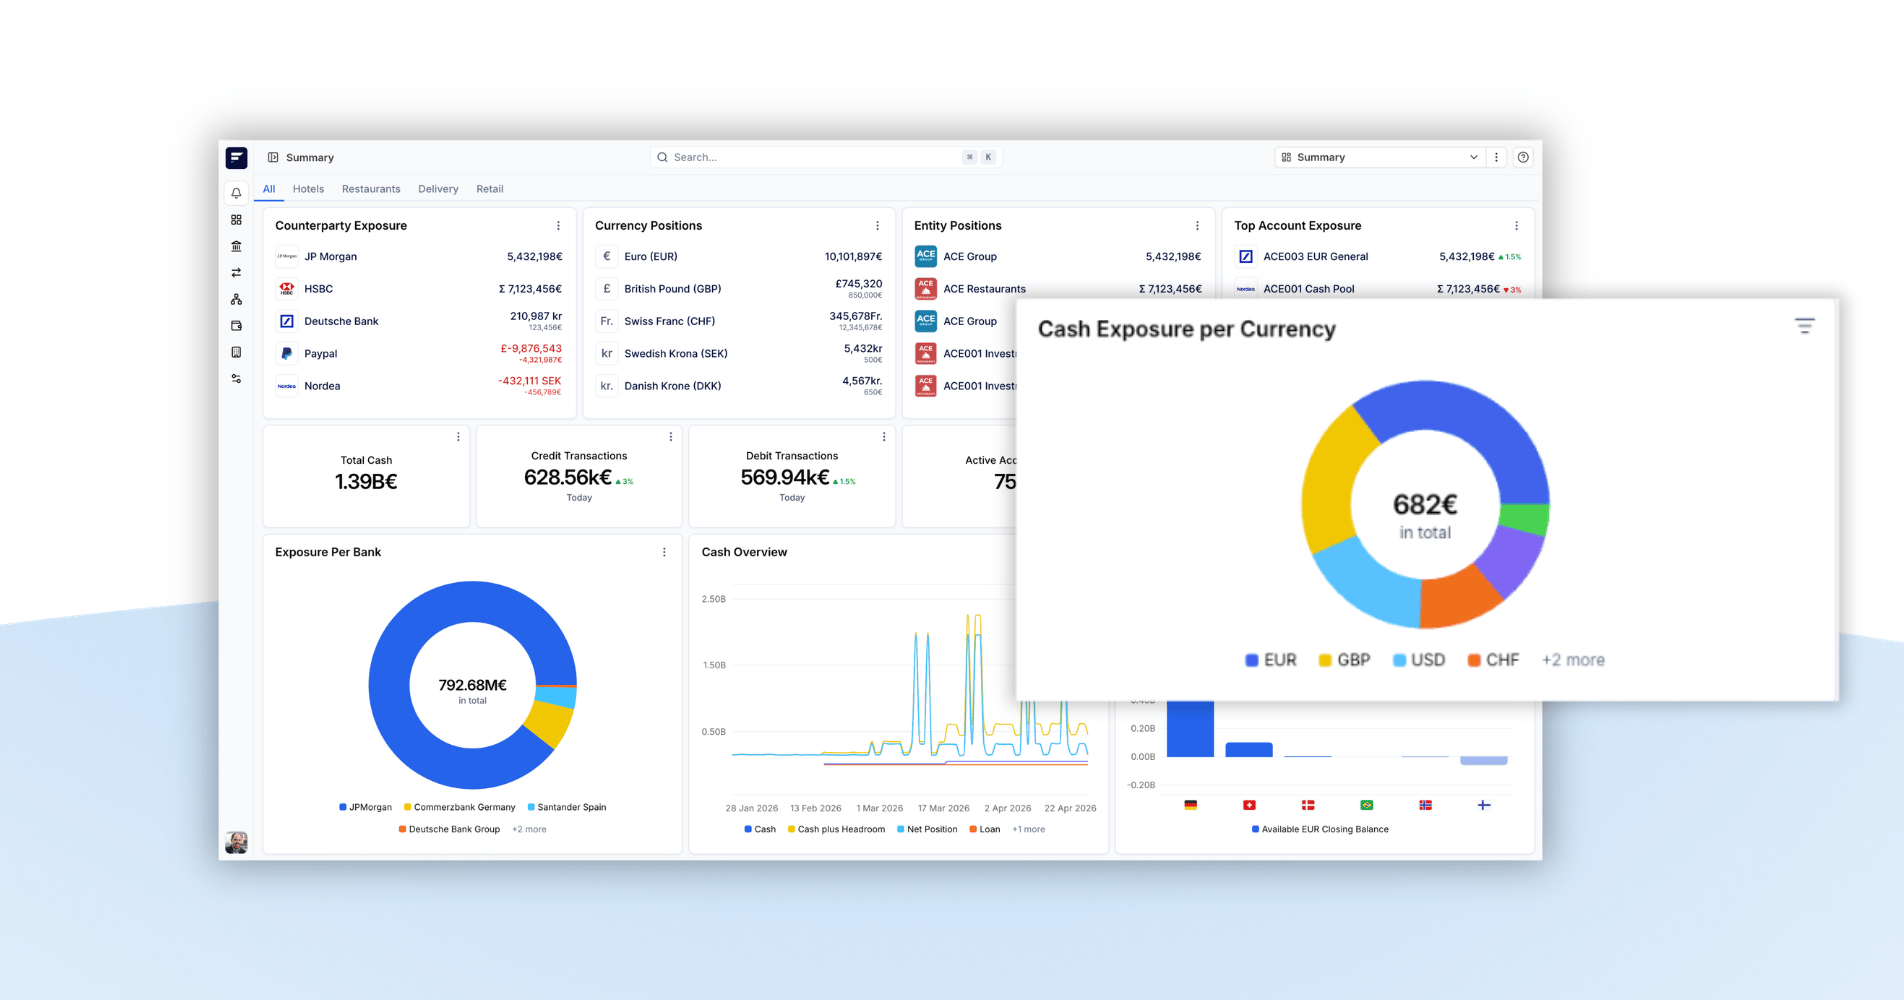
You can see a typical FinanceKey dashboard in action here:
A few things that distinguish how FinanceKey is built:
Bank connectivity that meets your demands. We enable API-based real-time connectivity, where available with support for both PSD2/Open Banking and Premium Banking APIs (yes – we’ve made PSD2 work for corporations).
Applying a hybrid approach to bank connectivity – combining API feeds where available with established file-based channels where they are not, to achieve real-time cash visibility. In practice, this means broader bank coverage from the outset, with a clear path toward real-time data as API availability matures across your banking network. You can also manually import statements or enter balance records.
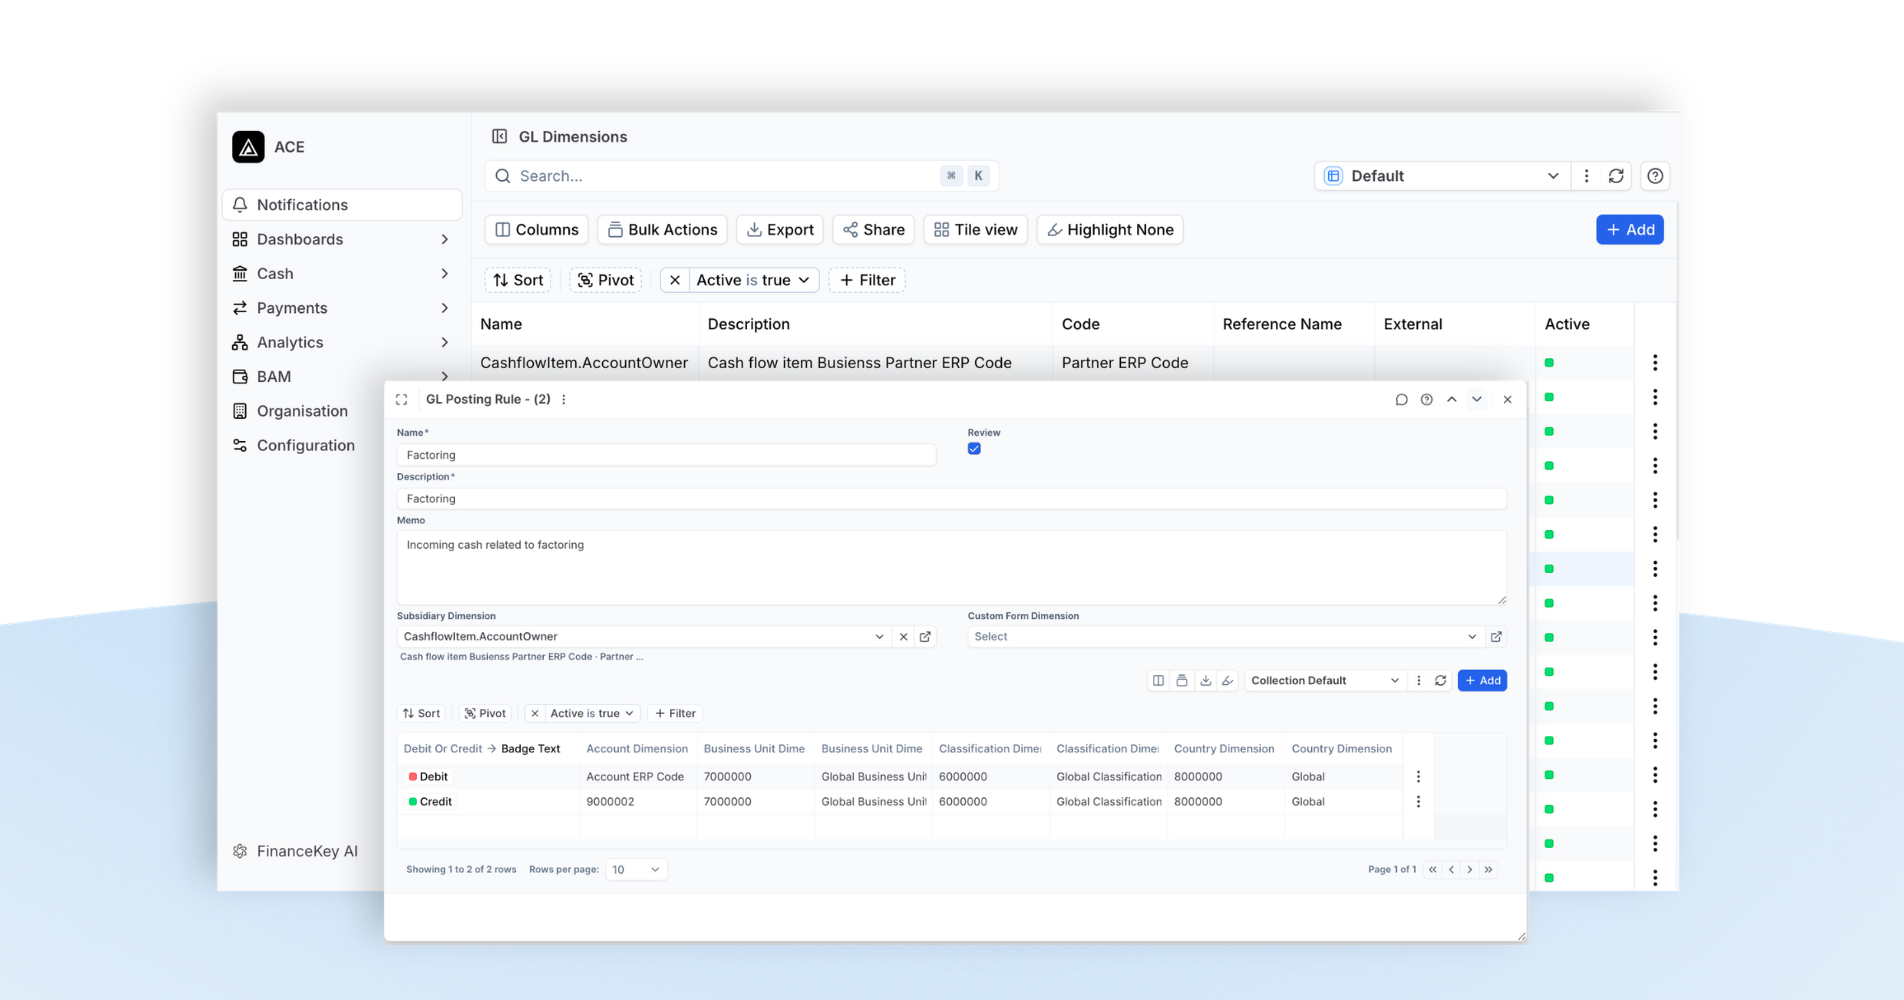
Reporting that reflects how your organisation is structured. Treasury and accounting teams often have different data requirements from the same underlying transactions. FinanceKey supports hybrid reporting – intraday via APIs and end-of-day via file-bases channels – that allows both sets of needs to be met in a single source, without separate reconciliation processes or parallel systems.
Cash visibility across banks, entities, and currencies in a single view. The platform consolidates balances and transactions across your full banking landscape, with drill-down from group level to entity and account level – so the CFO and treasury team are always working from the same accurate position.
When you are looking to build a treasury data hub and a liquidity dashboard, FinanceKey sits above your existing solutions as an orchestration layer, which means implementation does not require replacing systems already in place. It is designed to complement your existing system landscape – connecting what you have and making it visible in one place.
If you’re building the case for a real-time liquidity dashboard and want to understand how FinanceKey could fit your setup, get in touch.