Pivoting in FinanceKey: turn raw data into instant insight
By Topias Vainio, Treasury Solutions Manager at FinanceKey
Treasury teams work with data from many places – bank portals, ERPs, treasury solutions, internal systems – often arriving as long lists or inconsistent files that require copying, pasting, and restructuring before they’re usable.
Excel pivot tables can help pull it together, but they require manual updates and need to be rebuilt when the data changes.
Pivoting in FinanceKey removes that friction. You can now generate your own custom reports – grouping, comparing, and summarising data in seconds – all powered by FinanceKey’s unified, real-time view of your entire treasury landscape.
What pivoting is in plain terms
If you’ve used an Excel pivot table before, the concept will feel familiar. If not, FinanceKey makes it easy.
Let’s say you’re looking at a table of bank account transactions. You might apply some filters to make sense of the data. However, filtering simply shows or hides rows – it narrows the data but doesn’t change its structure. Pivoting goes further: it reorganises and summarises the data into a bespoke report, while preserving the original source.
A filter can answer “show me EUR payments,” while a pivot can answer “show me total EUR payments per entity per week.” It’s the difference between viewing the data and formating it to answer a specific question.
Pivoting lets you:
- Organise data into meaningful categories
- Summarise large datasets without formulas
- Compare across entities, banks, currencies, accounts, or time
- Build flexible, dynamic reports in seconds.
FinanceKey calculates this all automatically – you simply choose how you want the data arranged.
How pivoting works in FinanceKey
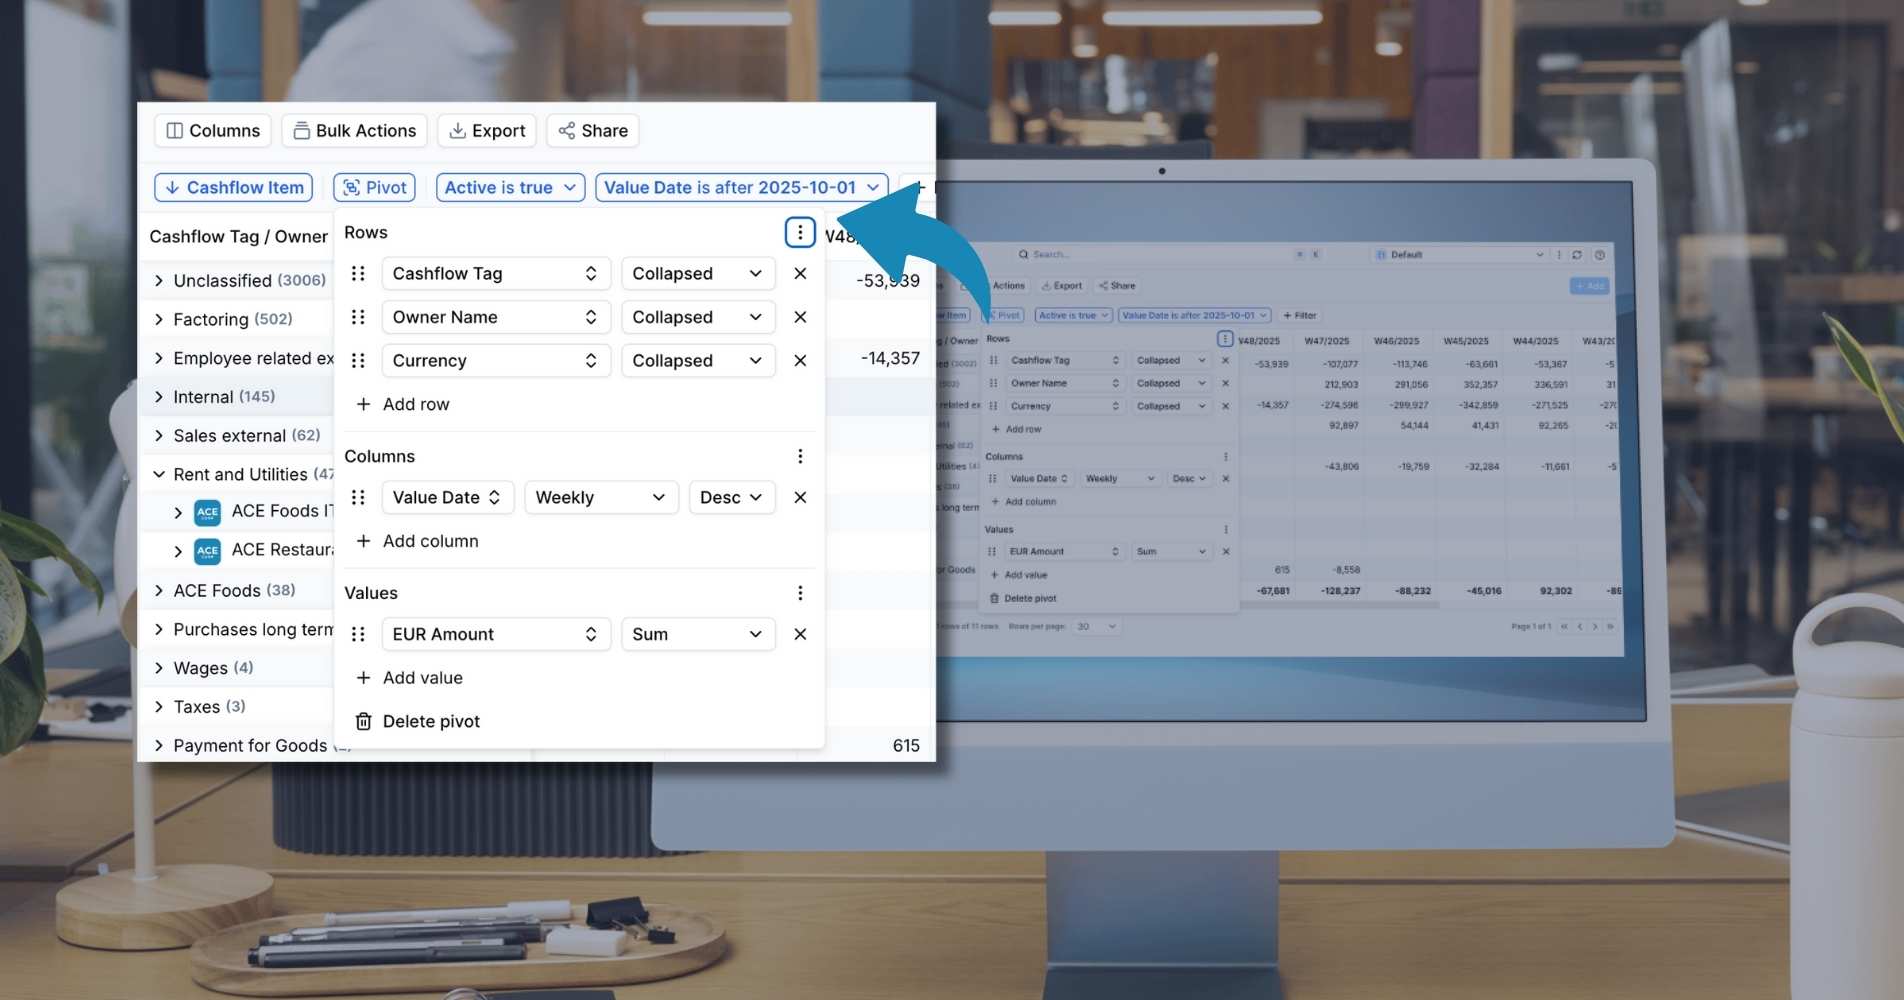
Setting up a report using pivoting couldn’t be easier. In this video, we’ll apply some pivots to a table of cash flow data:
NB: In the above demo, cash flow tagging had already been set up to categorise actual and future transactions. Read our guide to cash flow tagging in FinanceKey for more on this.
How pivoting helps finance teams
Your treasury data becomes immediately analysable
You can explore trends and questions as soon as the data is available – no exporting or reformatting required.
You can save and reuse your reports
Any configuration can be saved and shared with your team (depending on their permissions), so daily cash views, weekly payment breakdowns, or entity comparisons are always one click away.
It works for all experience levels
Pivoting feels natural if you’re familiar with pivot tables, and approachable if you’re not. There’s no setup, no formulas, and no risk of breaking a complex spreadsheet.
It supports fast decision-making
When questions arise – Why did balances move? Where is volume spiking? How did yesterday compare to last week? – you can create or adjust your reports in moments.
It sets the foundation for forecasting and analytics
Structured, time-based pivots unlock deeper insights into:
- Liquidity patterns
- Behavioural trends
- Variance vs expected flows
- Operational performance.
This lays the groundwork for more advanced reporting and forecasting features.
Examples of pivoting in action
Here are some of the ways our customers are using pivoting inside FinanceKey:
- Breaking down payment cycles by debtor bank before approving outgoing payments
- Producing monthly payable summaries grouped by currency and legal entity
- Generating a liquidity report pivoted by entity, currency, and bank without rebuilding datasets
- Comparing balances or payment volumes across multiple banks, regions, or currencies
- Surfacing trends such as daily cash movements or weekly volume spikes
The FinanceKey advantage
Excel remains a core tool for many treasury teams, and pivot tables are widely used for analysis. FinanceKey complements this by providing a faster, more seamless way to reach the first level of insight.
Pivoting isn’t only for bank statements. In FinanceKey, it works across all your cash movements – from actual bank transactions to ERP-derived invoices and payables. This means you can pivot not just by entity, bank, or currency, but also by cash flow tags, due dates, categories, and forecasted vs actual movements. It’s a flexible way to analyse your entire liquidity landscape in one place.
The key difference is that FinanceKey pivoting works directly on live data, meaning there’s no need to:
- Download or import files
- Clean or prep the data
- Rebuild pivots as new information arrives.
Build your report once, save it, and FinanceKey keeps it updated.
Want to see pivoting in action? Contact us to book a demo today.